
Does ESG Actually Pay? What 2,497 Companies Tell Us and Why It Matters for Indonesia

Updated: Jun 14
The question that won't go away
Walk into any boardroom, asset management committee, or sustainability conference in 2026, and you'll hear the same argument on loop. One side insists that companies with strong environmental, social, and governance practices outperform, that ESG is the smart money signal of the next decade. The other side calls it a costly distraction, a tax on shareholders dressed up in moral language. A third camp shrugs: ESG is neither virtue nor vice, just noise.
The stakes aren't academic. More than $35 trillion in global assets over a third of all professionally managed money, now sits in funds that claim to integrate ESG factors. If the skeptics are right, that's a historic capital misallocation. If the believers are right, the firms still ignoring ESG are leaving real money on the table. We wanted a clearer answer. So we built one.
This research note examines what 2,497 publicly listed companies, spanning 47 industries, can tell us about whether ESG performance translates into financial performance, and whether ESG-leading companies actually deliver better stock returns. We tested the data six different ways, including methods designed specifically to catch the kinds of statistical illusions that plague this field. The results are clearer than we expected, more nuanced than the headlines suggest, and for Indonesia specifically - point to a strategic opportunity that most investors have missed.
Better ESG companies are more profitable.
Across every metric of profitability we examined: return on assets, return on equity, return on invested capital. Companies with higher ESG scores consistently generated stronger financial results. The pattern is monotonic, meaning it gets stronger at every step up the ESG ladder, not just at the extremes.
Consider what happens when you sort companies into five tiers by ESG score and look at their average return on assets. The lowest-ESG tier produces an ROA of negative 7%. The highest-ESG tier produces a positive 5.6%. That's a 12.6 percentage point gap in operational profitability, and it's not a statistical fluke, it survives every robustness check we threw at it.
Return on equity tells an even more dramatic story: a swing from negative 13.6% to positive 18.2% as you move up the ESG ladder. A 31.8 percentage points spread in capital efficiency, separating the ESG laggards from the ESG leaders.

High-ESG companies have a lower cost of capital
Markets don't price companies by accident. When a company can borrow more cheaply and raise equity at a lower cost, that signals something the market believes about its risk profile. We found that higher ESG scores are associated with measurably lower weighted average cost of capital, a relationship that held across 19 of 25 industries we examined.
The effect size per ESG point is modest, but the direction is unambiguous and broad. The market, in aggregate, treats ESG leading companies as lower risk borrowers and lower risk equity investments. That alone has implications for how Indonesian companies competing for international capital should think about their sustainability disclosures.
ESG alpha is real, but on a delayed fuse
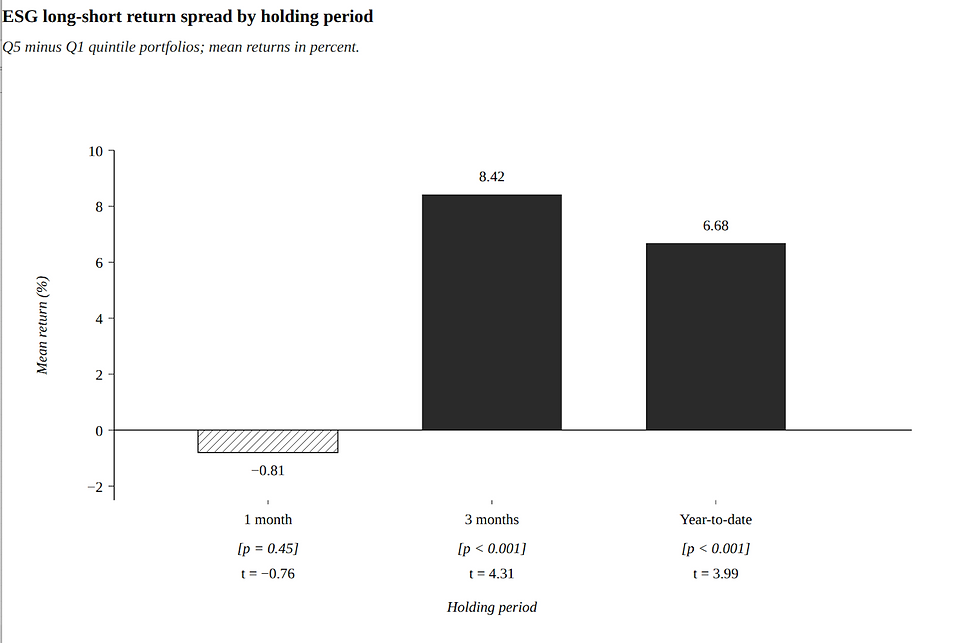
Alpha in finance measures an investment's performance relative to a benchmark index. the finding that should command the most attention from investors. Companies in the top ESG quintile outperformed companies in the bottom ESG quintile by 6.68 percentage points year-to-date. The result is statistically significant, with a t-stats of 3.99, well past the threshold investors typically demand before allocating real capital.
The relationship survives even after we control for the things that usually explain returns: cost of capital, profitability, and operating margins. Each one-point increase in ESG score is associated with an additional 1.28 percentage points of return, independent of how profitable or cheaply financed the company is.
This is the first session of an ongoing SANARA Research series on the financial materiality of sustainability in emerging markets. The next installment, scheduled for June 2026, will move the analysis from cross-sectional correlation to panel-data causation, applying Fama-French risk-factor controls and dynamic estimation methods to the same 2,497 firm universe. In the next article we will examine sector specific applications to Indonesian listed corporates and the implications for sovereign and sovereign credit.

Comments